
Healthcare financial leadership operates under unprecedented structural pressure. Operating margins across major health systems remain tight while physical facility operating expenses continue to escalate. Hospital real estate is a uniquely complex asset class: it runs 24/7/365 under strict clinical environmental parameters where temperature, humidity, air-exchange rates, and pressure differentials correlate directly with patient outcomes, infection control, and life-safety compliance.
Hospital facilities consume 2.5 to 3 times more energy per square foot than standard commercial office buildings, driven by the high Energy Use Intensity required for continuous climate control and specialized clinical equipment (ENERGY STAR). Globally, healthcare accounts for roughly 4–5% of total greenhouse gas emissions (PMC), while the U.S. healthcare system alone generates 8.5% of national emissions (PMC). Meanwhile, a deferred-maintenance backlog exceeding $390 billion continuously bleeds capital through emergency repairs, inflated utility bills, and compliance exposure (Richard Group).
2.5–3×
Hospitals consume 2.5 to 3 times more energy per square foot than standard commercial office buildings.
$390B
The deferred maintenance backlog across U.S. health facilities — bleeding capital through emergency repairs and inflated utility bills.
80%+
Share of a facility asset's lifetime cost that occurs in operations, energy, and maintenance — not acquisition (IFMA / APPA TCO models).
20–30%
Operational performance improvement available when facility operations align with enterprise frameworks (McKinsey & Company).
Every dollar wasted on inefficient HVAC operation, uncalibrated medical chillers, or unverified vendor billing is a dollar stripped from clinical expansion, staff retention, and patient care. To break the stalemate, CFOs, Chief Sustainability Officers, and Chief Administrative Officers must stop treating facilities as a passive cost center — health systems that align facility operations with enterprise performance frameworks achieve a 20–30% improvement in operational efficiency (McKinsey & Company).
This guide lays out how modern Computer-Aided Facility Management platforms — such as Reflexion CAFM by Lattice — act as the operational data engine that converts facility telemetry into board-level financial precision: total-cost-of-ownership optimization, decarbonization, and audit-ready ESG compliance.
Key takeaways
- Hospital real estate is a 24/7/365 asset class where temperature, humidity, and air-pressure control correlate directly with patient outcomes — and with 2.5–3× the energy intensity of commercial offices.
- Over 80% of a facility asset's lifetime cost sits in operations and maintenance. Reactive "run-to-failure" strategies bleed capital through overtime labor, expedited parts, and emergency rentals.
- The Asset Condition Index (ACI) turns capital planning into a data exercise: below 40%, maintain and monitor; in the 40–60% band, run a structured repair-vs-replace review.
- Connecting BMS/IoT telemetry to a CAFM engine converts energy anomalies into automatic work orders — and every utility dollar saved equals roughly $20 of new revenue for a 5%-margin health system.
- Institutional ESG reporting now demands time-stamped operational evidence, not spreadsheets. A CAFM platform like Reflexion is the data engine beneath Scope 1, 2, and 3 disclosures.
| Operational & financial benchmark | Industry baseline / metric | Primary impact on the healthcare balance sheet |
|---|---|---|
| National deferred maintenance backlog | $390 billion across U.S. health facilities | Drives capital starvation and emergency asset failures |
| Facility Energy Use Intensity (EUI) | 2.5× to 3× higher than commercial office space | Severe exposure to volatile electricity and gas tariffs |
| Healthcare greenhouse gas emissions | 8.5% of total U.S. emissions / 4–5% globally | Escalating regulatory exposure and institutional ESG reporting risk |
| Total cost of ownership distribution | Over 80% of lifecycle costs occur in operations | Long-term financial risk concentrates in daily OpEx and maintenance |
| Operational performance recovery | 20–30% potential efficiency improvement | Unlocks trapped operational capital for clinical reinvestment |
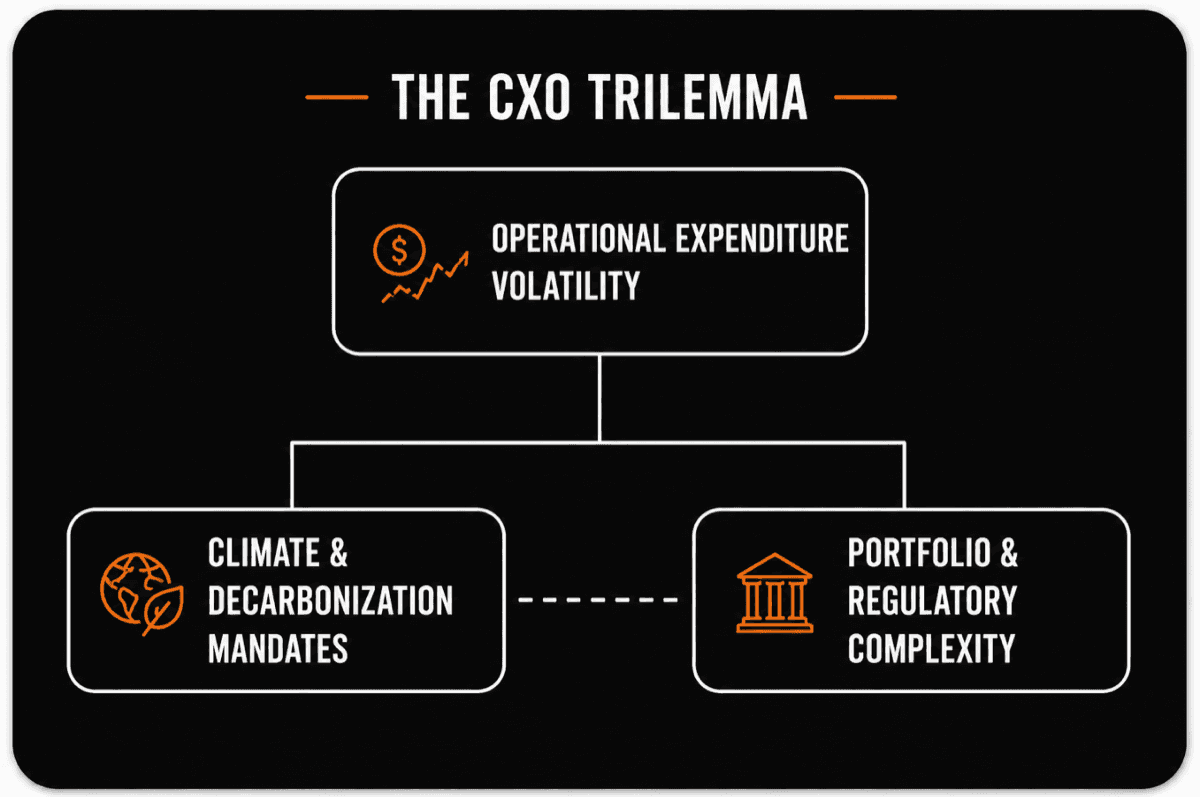
The CXO trilemma: energy volatility, deferred maintenance, and portfolio complexity
Managing healthcare real estate means balancing non-negotiable operational uptime against severe cost inflation and aggressive regulatory mandates. A single failure in negative-pressure ventilation, operating-theatre temperature regulation, or emergency backup power directly jeopardizes human life and clinical licensure.
The financial anatomy of utility volatility
Hospitals carry massive baseload energy: high air-changes-per-hour mandates, continuous refrigeration for blood banks and biologics, high-volume steam sterilization, and energy-dense imaging equipment. A single MRI machine dramatically elevates a building's source energy consumption and demands dedicated cooling (ENERGY STAR hospital benchmarks). That load leaves balance sheets exposed on three fronts:
- Peak-demand surcharges. Uncoordinated chiller staging or uncalibrated air handling units can spike electrical draw during regional peak hours, triggering severe tariff penalties.
- Power-factor penalties. Inductive loads from compressors, supply fans, and pumps distort power efficiency; without continuous monitoring, the distortion lands as direct charges on the monthly statement.
- Thermal inefficiency. An unmaintained central chiller plant can lose 10–20% of its coefficient of performance within 24 months — thousands of excess kilowatt-hours with zero added cooling.
The compounding cost of deferred maintenance
Over half of healthcare facilities operate in buildings exceeding 50 years of age, and 79% of facility managers report receiving less than half of their requested maintenance funding. When strategy defaults to run-to-failure, budgets absorb three compounding penalties: emergency work orders carry extreme premiums (overtime labor, air-freighted parts, clinical re-scheduling); last-minute replacements forfeit the volume pricing that 2–3 year planned procurement captures; and deferred servicing shortens asset lifespans by up to 30%, accelerating the capital replacement cycle itself.
Regulatory and audit failure risk
The Joint Commission, NABH, ISO, and regional health authorities enforce strict physical-environment standards; non-compliance brings fines, provisional accreditation, or forced clinical closures. The mechanics are mundane — a clogged filter breaking pressure differentials in an isolation room, a missed 52-week generator test, an unmonitored hot-water loop breeding Legionella — but the consequences are existential. The defense is the same in every case: statutory PPM schedules with time-stamped digital evidence, which is precisely what a CAFM platform automates. (For the UAE equivalent of this compliance stack, see our CAFM buyer's guide.)
Financial leakage in vendor management
Health systems lean heavily on third-party specialists for chillers, elevators, medical gas, and fire suppression. Without an owner-controlled CAFM engine, three leaks go unnoticed: invoices paid without geotagged, time-stamped proof of field execution; SLA penalty clauses that can't be enforced because response times aren't tracked; and duplicate billing for work on assets still under manufacturer warranty. Reflexion closes all three with system-tracked SLAs, mobile proof-of-work, automated escalations, and a centralized warranty register.
Take control of healthcare operating expenses
See how Reflexion CAFM gives CFOs and CAOs multi-site visibility, SLA governance, and automated cost controls — live, on your own portfolio.
Capital asset lifecycle optimization: replacing run-to-failure with TCO data
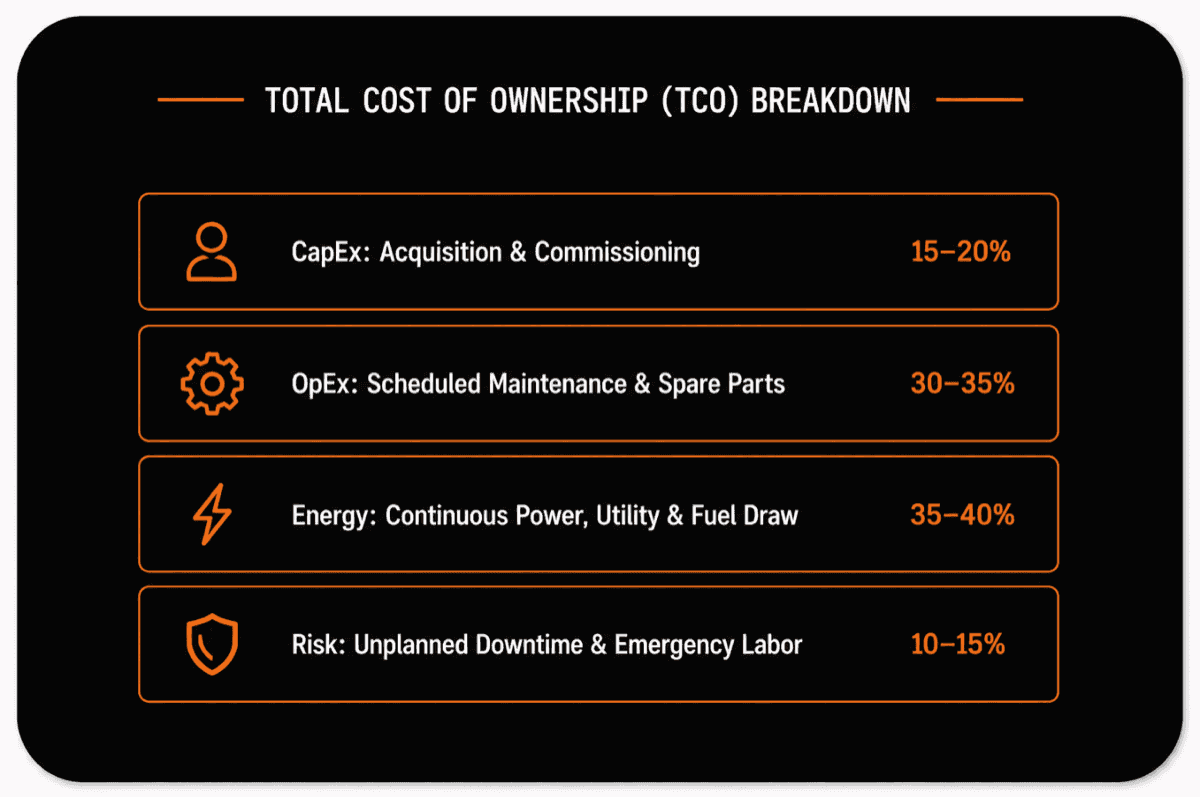
Traditional healthcare capital budgeting fixates on acquisition cost while ignoring operational impact. Under APPA and IFMA standards, procurement and commissioning represent only 15–20% of an asset's lifetime cost — operations, energy, and maintenance consume the rest (IFMA). Without granular asset visibility, CFOs end up approving expensive emergency repairs on dead assets, or funding premature replacements on vendor opinion instead of equipment telemetry.
The APPA / IFMA total cost of ownership model
TCO = Cacq + Cop + Cmaint + Cenergy + Crisk − Vres
The Asset Condition Index: degradation as a number
Rather than arbitrary useful-life tables, predictive capital planning uses an Asset Condition Index — cumulative maintenance spend as a percentage of current replacement value. Reflexion CAFM calculates it continuously for every registered asset by aggregating work orders, technician hours, spare-part issuances, and BMS energy anomalies.
Asset Condition Index (ACI) decision bands
ACI = cumulative maintenance & repair cost ÷ current replacement value × 100
Good condition
Optimal performance; meeting manufacturer baseline efficiency
Strategy: Maintain the standard 52-week PPM schedule
Balance-sheet impact: Lowest TCO; predictable baseline OpEx
Fair condition
Minor operational wear; energy draw spikes detected
Strategy: Shift to condition-based monitoring; audit vendor service quality
Balance-sheet impact: OpEx inflation begins; watch for accelerating component failure
Threshold warning
Frequent component failure; cumulative repairs approaching half of replacement value
Strategy: Trigger a formal repair-vs-replace CapEx review
Balance-sheet impact: High risk of unplanned clinical disruption
Critical degradation
A financial “money pit” — severe energy inefficiency and breakdown risk
Strategy: Immediate capital replacement or major planned overhaul
Balance-sheet impact: Emergency downtime risk; active drain on operational reserves
Option A — Repair & overhaul
- ACI below ~50% and remaining useful life over 5 years
- Full replacement carries extreme structural or downtime cost
- Execute a targeted component overhaul and re-baseline
Option B — Capital replacement
- ACI above ~50% or energy draw 20%+ over rated baseline
- Modern-efficiency units and active warranty options available
- Schedule a 24-month planned procurement to capture volume pricing
Three tests anchor the repair-vs-replace review:
- Cumulative repair ratio. Once lifetime maintenance spend crosses 50% of replacement value, further repair yields diminishing returns.
- Energy-efficiency penalty. A degraded 10-year-old chiller consuming 20% more kWh per ton than a modern unit often pays for its own replacement within a 36-month utility payback.
- Clinical criticality. Assets serving zero-tolerance environments — operating rooms, ICUs, isolation suites — justify replacement at lower ACI thresholds than administrative-wing equipment.
A worked 5-year capital forecast
Integrating the asset register with ACI trends replaces emergency purchasing with rolling multi-year forecasts — eliminating rushed engineering fees, premium freight, and the 20–30% markups of expedited procurement, while temporary infrastructure rentals (a trailer-mounted chiller runs $30,000 to $80,000 per month) disappear from the ledger entirely (ASHE).
| High-value asset | Age / baseline life | ACI | Failure horizon | Maintenance OpEx | Planned CapEx | Strategic financial impact |
|---|---|---|---|---|---|---|
| 500-ton centrifugal medical chiller | 12 yrs / 15-yr life | 54% | Year 2 | $48,000/yr (rising 15%/yr) | $420,000 planned | Avoids ~$95,000 emergency rental-chiller expense; cuts cooling EUI by ~22% |
| Sterile-processing steam sterilizer | 9 yrs / 10-yr life | 62% | Year 1 | $22,000/yr (severe leak history) | $110,000 planned | Eliminates surgical scheduling cancellations; avoids audit non-compliance fines |
| 2,000 kW emergency diesel generator | 18 yrs / 25-yr life | 28% | Year 5 | $8,500/yr (stable) | $310,000 future forecast | Stays on standard 52-week testing; defers major CapEx 48+ months |
| Surgical-suite air handling unit | 14 yrs / 15-yr life | 48% | Year 3 | $16,500/yr (fan motor wear) | $185,000 planned | Maintains positive-pressure compliance; prevents HAI liabilities |
The same asset engine protects warranty value: scanning an asset's QR code in the field surfaces active warranty terms and service contracts before a technician — or an invoice — touches it, and assets trending toward the 40% ACI threshold are placed automatically onto the multi-year CapEx queue where supply-chain teams can negotiate bulk pricing.
Optimize your capital budget with predictive TCO analytics
See how Reflexion automates Asset Condition Index scoring, prevents premature replacements, and captures procurement savings.
Decarbonization and automated energy management: efficiency as recovered margin
HVAC, central chillers, and steam sterilization account for up to 65% of total building energy in acute-care facilities (ENERGY STAR). Because hospitals never close, efficiency is a direct margin-recovery mechanism: for a non-profit system at a 5% operating margin, every dollar saved on utilities is equivalent to $20 of new revenue.
Traditional energy monitoring reviews utility bills 30–60 days after the waste occurred. Modern energy management wires the building directly into the CAFM engine over standard industrial protocols — BACnet for chiller plants, AHUs, and VAV boxes; Modbus for sub-meters, power-quality analyzers, and VFDs; MQTT for wireless IoT sensors measuring differential pressure and pipe temperatures.
Three high-load systems repay continuous tuning fastest:
- Chiller plant staging. Sequencing chillers against real-time wet-bulb temperature and load keeps lead units inside their 60–80% peak-efficiency band.
- Surgical-suite air changes. ORs need 20+ air changes per hour during procedures — but CAFM-scheduled night setbacks cut fan power while preserving positive pressure and infection control.
- Steam and boiler control. Failed steam traps and uninsulated lines silently waste thousands of therms; telemetry flags them instantly.
Refrigerant management and EPA Section 608
Chiller refrigerants such as R-134a and R-410A carry global-warming potentials hundreds to thousands of times higher than CO₂. Under EPA Section 608, comfort-cooling equipment holding 50+ pounds of refrigerant faces a 15% annual leak-rate threshold, with mandatory repair procedures beyond it (EPA). An unmonitored leak in a 500-ton chiller degrades compressor efficiency by up to 20% while accruing federal compliance exposure. Reflexion enforces the discipline digitally: every pound recovered or added is logged through permit-to-work workflows, leak rates are calculated automatically from charge volumes, and time-stamped logs prove verification tests happened inside mandated windows.
Energy-as-a-Service: modernization without CapEx
Capital-rationed systems can still modernize chillers, lighting, and drives. Under an Energy-as-a-Service or energy savings performance contract, a provider finances, builds, and operates the infrastructure, paid from guaranteed utility savings:
| Financial variable | Traditional CapEx project | Energy-as-a-Service (EaaS) | Executive impact |
|---|---|---|---|
| Upfront capital expenditure | Requires 100% upfront CapEx allocation ($1M–$5M+) | $0 upfront; externally financed | Preserves capital reserves for clinical & diagnostic expansion |
| Balance-sheet treatment | Capitalized liability; increases debt-to-equity ratios | Operating-expense treatment; off balance sheet | Protects bond ratings and borrowing capacity |
| Performance & technology risk | Borne entirely by the internal facilities team | Transferred to the EaaS provider via performance guarantees | Vendor absorbs equipment downtime risk |
| Measurement & verification | Manual utility-bill comparison; unverified baseline | Automated M&V adhering to IPMVP standards | Audit-ready proof of energy and carbon reductions |
The catch is verification. Health systems should run their CAFM platform as the independent measurement-and-verification engine — continuously logging sub-metered kWh, thermal loads, and weather-adjusted baselines against IPMVP standards — so vendor savings guarantees are validated by the owner's own data, not the vendor's.
Spatial intelligence: unlocking value in hospital footprints
Real estate is typically a health system's second-largest expense after payroll, yet merger-driven growth leaves many portfolios fragmented and unmapped. Vacant or underutilized square footage quietly burns clinical-grade heating, cooling, and janitorial spend without producing patient revenue. The corrective metric is Revenue Per Available Square Foot (RevPASF) — net clinical operating revenue divided by available clinical floor space — and the corrective process runs in three phases:
- Space inventory audit. A digital register of every owned and leased square foot across the network eliminates ghost-leased space and unverified common-area charges.
- Utilization heat-mapping. Overlaying work-order density on floor plans exposes structural problem zones, while mobile guard-patrol logs, NFC scans, and IoT footfall sensors verify real occupancy across remote sites.
- Asset and lease realignment. Underperforming space is converted to revenue-generating clinical use, sub-leased, or exited — reclaiming millions in net present value across regional portfolios.
Accounting rules raise the stakes: under ASC 842 and IFRS 16, nearly all operating leases sit on the balance sheet as right-of-use assets with matching liabilities (FASB). Underutilized leased space now directly inflates reported liabilities and pressures debt-to-equity ratios. Reflexion supplies the operational layer — verified clinical vs. non-clinical square footage for auditing landlord charges, and a lease-milestone engine that flags renewal, contraction, and expansion windows 6–12 months out, before costly automatic rollovers.
Institutional-grade ESG: converting operational data into board-level intelligence
ESG performance has shifted from corporate communications to financial imperative: lenders, bond raters, and health authorities increasingly tie capital access and interest rates to verified sustainability performance, and 68% of healthcare CFOs now hold direct accountability for ESG metrics (Page Executive). The obstacle is data integrity — manual spreadsheets and retrospective bill entry fail institutional audits and invite greenwashing claims under the GHG Protocol, CSRD, and TCFD (GHG Protocol).
The fix is architectural: ERP and ESG platforms aggregate and report, but the CAFM engine underneath is what captures tamper-evident operational truth — then feeds it upstream via REST APIs to SAP, Oracle, and board dashboards.
| GHG scope | Physical source in the facility | CAFM data-capture mechanism | Reporting output |
|---|---|---|---|
| Scope 1 — direct emissions | Emergency diesel generators, gas boilers, medical gas leaks, HVAC refrigerants | Real-time fuel logs, digital permit-to-work, refrigerant recharge logs | Verified direct carbon metric (tCO₂e) |
| Scope 2 — indirect emissions | Purchased electricity, district steam & chilled water for 24/7 climate control | BMS/IoT sub-metering, utility-bill integration, automated EUI tracking | Verified market-based metric (kBtu/sq ft · CO₂e) |
| Scope 3 — value chain | Waste disposal, contractor transport, equipment supply chain | Digital waste-manifest tracking, contractor SLA & dispatch logs | Verified supplier carbon proxies |
The executive implementation roadmap
Transitioning healthcare real estate from financial burden to sustainable asset engine follows five phases:
Phase 1 — Audit & baseline
Comprehensive asset inventory and GHG baseline across owned and leased facilities — true EUI, degradation scores, deferred-maintenance backlog.
Phase 2 — Align leadership
Shared KPIs across the CFO, CSO, and CAO offices: unified TCO targets and verifiable carbon-reduction benchmarks instead of siloed goals.
Phase 3 — Deploy enterprise CAFM
Centralized asset registers, automated 52-week PPM, contractor SLA enforcement, and mobile field synchronization across all sites.
Phase 4 — Integrate BMS, SCADA & IoT
Sub-meters, sensor networks, and building automation connected to the CAFM engine for condition-based maintenance and instant utility anomaly alerts.
Phase 5 — Reinvest & scale
Automated exports into corporate ERPs (SAP/Oracle) and ESG frameworks; recovered OpEx redirected into clinical expansion.
Data-driven operational control changes the financial dynamic of healthcare real estate. By optimizing capital asset lifecycles, eliminating energy waste, and enforcing spatial efficiency through a platform like Reflexion CAFM, executives turn physical facilities into engines of permanent financial and environmental value — with every claim backed by an audit trail.
Frequently asked questions
Why do hospitals cost so much more to operate than commercial buildings?
Hospitals run 24/7/365 under strict clinical environmental parameters — high air-change rates, continuous refrigeration for blood banks and pharmaceuticals, steam sterilization, and energy-dense imaging equipment like MRI and CT scanners. That drives 2.5 to 3 times the energy use per square foot of a commercial office, and exposes health systems to peak-demand surcharges, power-factor penalties, and thermal inefficiency losses.
What is total cost of ownership (TCO) in healthcare facilities management?
TCO measures an asset's full lifetime cost: acquisition, operations, maintenance, energy, and risk, minus residual value. Under IFMA and APPA models, acquisition accounts for only 15–20% of lifetime expense — over 80% occurs in operations and maintenance. Managing to TCO instead of purchase price shifts capital planning from reactive firefighting to forecastable, volume-priced procurement.
What is an Asset Condition Index (ACI) and how is it used?
ACI compares an asset's cumulative maintenance and repair spend against its current replacement value, expressed as a percentage. Below 15% is healthy; 16–39% calls for condition-based monitoring; 40–60% triggers a formal repair-vs-replace capital review; above 60% the asset is actively draining reserves and should be replaced through planned CapEx. A CAFM platform calculates ACI continuously from work-order and cost history.
How does CAFM software support ESG reporting for healthcare?
Audit-grade ESG reporting under frameworks like the GHG Protocol, CSRD, and TCFD requires emissions data traceable to time-stamped operational records. A CAFM engine captures Scope 1 sources (generator fuel logs, refrigerant recharges via digital permit-to-work), Scope 2 (sub-metered electricity and EUI tracking), and Scope 3 proxies (waste manifests, contractor dispatch logs), then exports verified data to ERP and ESG platforms via APIs.
What is Energy-as-a-Service (EaaS) and when does it make sense for hospitals?
Under an EaaS or energy savings performance contract, a third party finances, builds, and maintains high-efficiency infrastructure — chiller plants, LED retrofits, VFDs — with zero upfront CapEx, paid from guaranteed utility savings as an operating expense. It suits capital-constrained health systems that want to modernize without impairing bond ratings, provided savings are independently verified against IPMVP standards.
Where should a health system start with facilities cost optimization?
Start with a portfolio-wide audit: a complete asset register, energy-use baseline, and deferred-maintenance inventory. Then align finance, sustainability, and facilities leadership on shared TCO and carbon KPIs before deploying a CAFM platform, integrating BMS/IoT telemetry, and automating board-level reporting. Skipping the baseline is the most common reason optimization programs stall.
Ready to transform your healthcare facility operations?
Speak with our healthcare CAFM specialists about recovering operational capital and achieving audit-ready compliance across your portfolio.